Questions we all have as prospective solar ‘investors’ (in the UK) include: will the generated energy cover my usage? What is my usage? Don’t our reliably drizzly summers make a mockery of this solar malarkey?
There is a theoretical approach to answering all these questions but thankfully these days it is easy finding someone whose mistakes we can look to for our benefit. You are reading from one such self-nominated guinea pig! Please have a look at the linked video for details of our household solar energy generation and also consumption so far this year (from installation in Mar20 to mid Oct20).
Our ideal position would be to generate more than we consume but we know that having an electric vehicle means this is unlikely given our typical 10,000 – 12,000miles per year usage. Our annual mileage this year has been reduced due to the lock-down in spring and reduce commutes to the office since.
Alternatively read below for a written summary of the data we have to date.
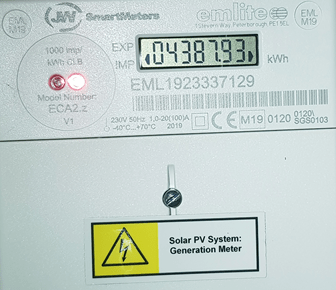
Before we had our system installed we calculated and estimated annual generation of 4,400kWh (see here for details of how get this estimate). Our meter generation meter (picture below) shows that the panels generated 4,387kWh between March and October (7months). I don’t expect that much will be generated over winter but I do not expect it to be zero and therefore expect that our system will comfortably exceed the initial estimate. Which leads to the following conclusions:
- the calculation used is an underestimate for my region (deliberately or not!)
- and/or this year could have been exceptional year for solar radiation in my region
The monitoring system shows that our household has consumed 3,474kWh in the year to date, this includes every electrical load we have including Electric Vehicle, washing machine, oven use etc. It means therefore that we have so far generated more energy than we have consumed and means our electric car use has effectively been free. Free fuel for the last 7months! we’ve done about 4,500miles in that time. How great is that 🙂

Whilst all the above feels good, we also know that the long winter is coming and generation will fall further behind this pattern is evident from Aug onwards.
From a cost perspective
When energy is generated, the active loads are prioritised and any remaining energy is put into the battery. Once the battery is fully charged the excess energy is exported back to the grid. We have an export tariff with Bulb (part of SEG), which pays us £0.0538/kWh for our exported energy. Overnight we import energy from the grid as we typically charge the car, run the dishwasher and washing machine. Our Go tariff with supplier Octopus energy means we pay £0.05/kWh for energy imported from the grid between 00:30 and 04:30. This means, provided we have exported sufficient energy during the day we are cost neutral as we charge the car in the night.
We have a home battery but the grid is an additional energy store for us, allowing us to drip-feed solar energy into it even on intermittent days but then extract it in useful concentrated amounts during the night.
We are big fans of the time of use tariffs that have been spurred on by the increasing uptake of electric vehicles and we are big fans of Octopus energy for being a leader in this area. As an added incentive for those looking for a new supplier use of the referrals will net £50 into your energy account (ours is here).
